Handling stack traces in Elasticsearch Logstash Kibana (ELK)
I use Elasticsearch Logstash Kibana (ELK) stack for visualizing lot of things like Nginx logs, HaProxy logs etc.
I also ingest application logs into the ELK. One thing I have been looking to do is visualization of errors happening into the system. Surely, Nginx and Haproxy logs can give you visualization of 500 status codes but there are many cases where the status code is 2xx but the internal error in the system is logged.
Our most of the microservices are written in Java / Python / Node.js and so I am only concentrating on those. A typical java exception stack trace when logged looks like this:
Exception in thread "main" java.lang.NullPointerException
        at com.example.myproject.Book.getTitle(Book.java:16)
        at com.example.myproject.Author.getBookTitles(Author.java:25)
        at com.example.myproject.Bootstrap.main(Bootstrap.java:14)
Normally, this will be ingested line by line in ELK stack, which breaks the entire message.
For entire stack trace to be ingested as a single message, we need to configure the multiline plugin either in Logstash or Filebeat.
I prefer to do this configuration in filebeat, here is how my typical configuration looks like:
filebeat:
  tail_files: true
  prospectors:
   -
      paths:
        - /var/log/example.log
      input_type: log
      document_type: log
      multiline.pattern: '^[[:space:]]'
      multiline.negate: false
      multiline.match: after
  registry_file: /var/lib/filebeat/registry
output:
  logstash:
    hosts: [" logstash_server "]
    worker: 4
    bulk_max_size : 8192
shipper:
logging:
  files:
    path: /var/log/filebeat
    rotateeverybytes: 10485760 # = 10MB
  level: info
The lines below in the configuration configures the multiline processing. i.e. If a line starts with series of spaces (as in the case of stack trace), it should be considered as a part of previous line.
multiline.pattern: '^[[:space:]]'
multiline.negate: false
multiline.match: after
Once, we configure the multiline, here is how our messages should look like:
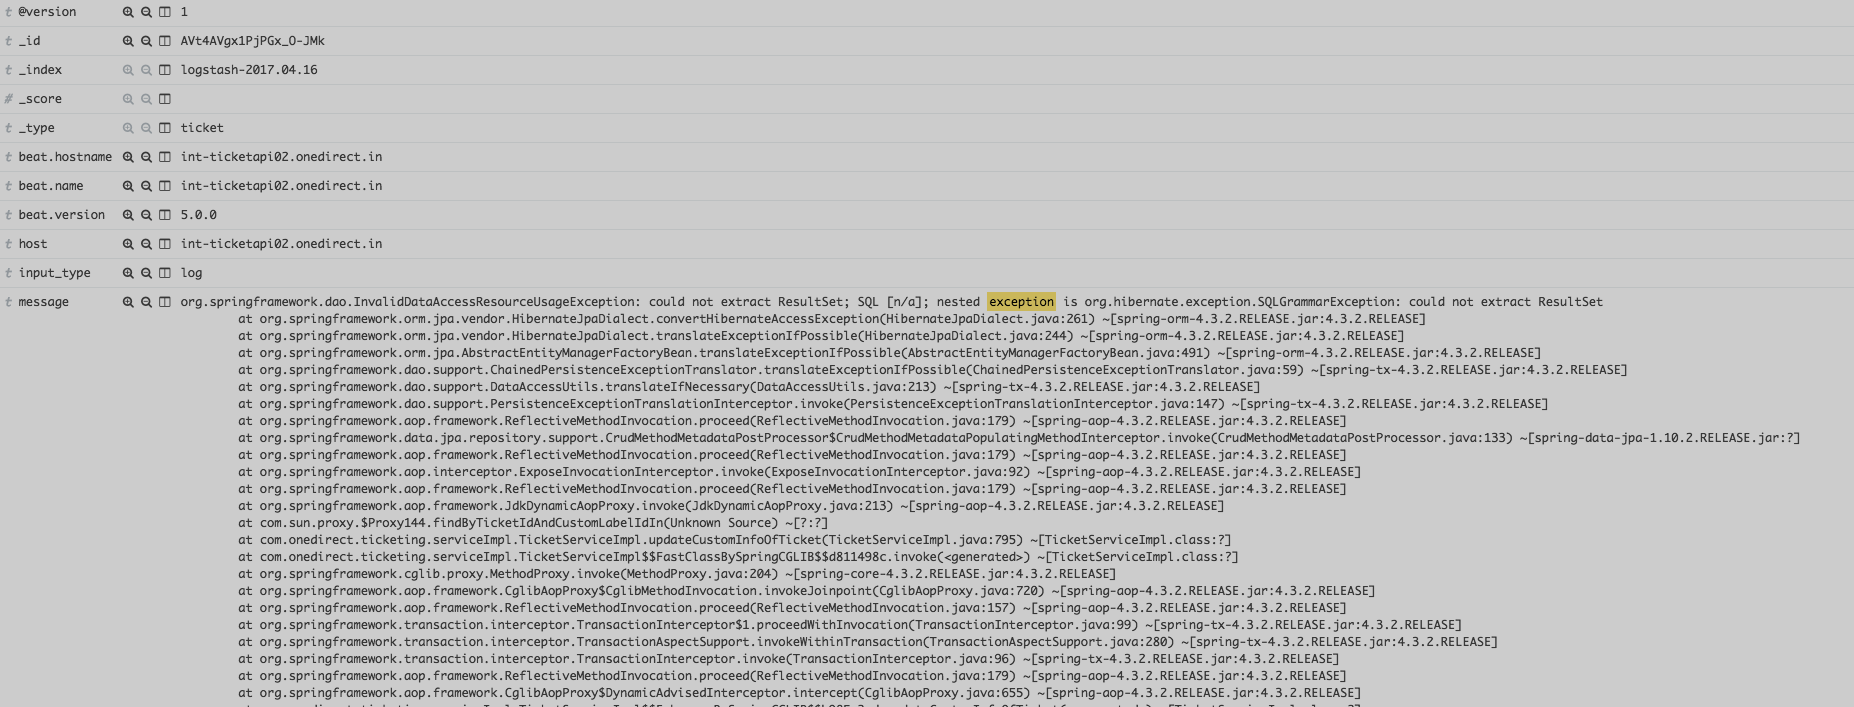
The next step is to parse this exception stacktrace and extract useful information like Exception class etc.
For this, we can use built in logstash parser JAVASTACKTRACEPART
grok {
                     match => { "message" =>[
                                               "%{JAVASTACKTRACEPART}"
                                             ]
                                }

              }
This will extract various useful fields like line no, class and method name from the exception stack trace.