Setting up Java project for monitoring
In any Java application deployed to monitoring, it is important to have proper monitoring / alerting infrastructure setup.
Apart from the infrastructure monitoring, it is essential to setup JVM metrics as well as application monitoring.
When I say application monitoring, it means monitoring the business transactions such as no. of orders / transactions, successful orders, failed orders , user signups, email triggered etc.
For this, we have to emit events from our application. These are usually called business metrics.
Dropwizard metrics is one of the standard libraries out there which allows you to emit events.
The events can be sent to various data stores, most popular being Graphite and Influxdb
The most popular types of metrics are:
-
Meters - A meter measures the rate of events over time. Also called as requests per second or TPS(transactions per second). Meters also track 1-, 5- and 15- minute moving averages, also called
m1_rate,m5_rateandm15_rate. Meters havemarkmethod to indicate the event. -
Counters - A counter is used to keep track of counts. For example pending jobs and total requests. Total requests etc. is usually a useless parameter but tools like graphite / influxdb can provide derivate function over the counters which can give us the additional functionality of meters using counters.
-
Timer - A timer measures both the rate a particular piece of code is called and as well as the distribution of its duration. Usually if you are using timer, you don’t need meter or counter, since those functionalities are implemented by timer as well. A good practice is to have timer for your normal execution and counter/meter for exception scenarios, so that you can visualize no. of errors or rate of errors. A timer also provides, percentile times using variables
p50,p75,p95,p98,p99and standard deviation.
When using Spring framework, Spring metrics provides tight integration with Dropwizard metrics
Its important to note that metrics-spring is a different library from Spring metrics , which is part of Spring framework itself.
The below code demonstrates a simple way to bootstrap spring application for monitoring using Dropwizard metrics and metrics-spring
buildscript {
    ext {
    }
    repositories {
        mavenCentral()
    }
    dependencies {
        classpath 'org.springframework.boot:spring-boot-gradle-plugin:1.5.16.RELEASE'
    }
}

group 'metrics-example'
version '1.0-SNAPSHOT'

apply plugin: 'java'
apply plugin: 'org.springframework.boot'

sourceCompatibility = 1.8

repositories {
    mavenCentral()
}

dependencies {
    compile("org.springframework.boot:spring-boot-starter-web")
    compile 'org.projectlombok:lombok:1.16.12'
    compile group: 'io.dropwizard.metrics', name: 'metrics-core', version: '4.1.0'
    compile group: 'io.dropwizard.metrics', name: 'metrics-graphite', version: '4.1.0'
    compile group: 'com.ryantenney.metrics', name: 'metrics-spring', version: '3.1.3'
    compile group: 'com.codahale.metrics', name: 'metrics-jvm', version: '3.0.2'
    testCompile group: 'junit', name: 'junit', version: '4.12'
}
package app;

import com.codahale.metrics.ConsoleReporter;
import com.codahale.metrics.Counter;
import com.codahale.metrics.JmxReporter;
import com.codahale.metrics.Meter;
import com.codahale.metrics.MetricFilter;
import com.codahale.metrics.MetricRegistry;
import com.codahale.metrics.graphite.Graphite;
import com.codahale.metrics.graphite.GraphiteReporter;
import com.codahale.metrics.jvm.GarbageCollectorMetricSet;
import com.codahale.metrics.jvm.MemoryUsageGaugeSet;
import com.codahale.metrics.jvm.ThreadStatesGaugeSet;
import com.ryantenney.metrics.spring.config.annotation.MetricsConfigurerAdapter;
import org.springframework.beans.factory.annotation.Value;
import org.springframework.stereotype.Component;

import javax.annotation.PostConstruct;
import java.net.InetSocketAddress;
import java.util.concurrent.TimeUnit;

@Component
public abstract class MetricsConfig extends MetricsConfigurerAdapter{

    private final MetricRegistry metrics = new MetricRegistry();
    Meter publishMeter = metrics.meter("publish.meter");
    Counter publishCounter = metrics.counter("publish.counter");

    @Value("${graphite.host}")
    private String graphiteHost;

    @Value("${graphite.port}")
    private int graphitePort;

    @Value("${graphite.amount.of.time.between.polls}")
    private long graphiteAmountOfTimeBetweenPolls;

    private String graphitePrefix;

    @PostConstruct
    public void run() {
        ConsoleReporter reporter = ConsoleReporter.forRegistry(metrics)
                .convertRatesTo(TimeUnit.SECONDS)
                .convertDurationsTo(TimeUnit.MILLISECONDS)
                .build();
        reporter.start(1, TimeUnit.SECONDS);

    }

    abstract protected void configureReporters();

    protected void configureReporters(String graphitePrefix) {
        this.graphitePrefix = graphitePrefix;
        configureReporters(metrics);
    }


    @Override
    public void configureReporters(MetricRegistry metricRegistry) {
        registerReporter(JmxReporter.forRegistry(metricRegistry)
                .build()).start();
        GraphiteReporter graphiteReporter =
                getGraphiteReporterBuilder(metricRegistry)
                        .build(getGraphite());
        registerReporter(graphiteReporter);
        graphiteReporter.start(graphiteAmountOfTimeBetweenPolls,
                TimeUnit.MILLISECONDS);
    }

    private GraphiteReporter.Builder getGraphiteReporterBuilder(MetricRegistry
                                                       metricRegistry) {
        metricRegistry.register("gc", new GarbageCollectorMetricSet());
        metricRegistry.register("memory", new MemoryUsageGaugeSet());
        metricRegistry.register("threads", new ThreadStatesGaugeSet());
        return GraphiteReporter.forRegistry(metricRegistry)
                .convertRatesTo(TimeUnit.SECONDS)
                .convertDurationsTo(TimeUnit.MILLISECONDS)
                .filter(MetricFilter.ALL)
                .prefixedWith(graphitePrefix);
    }

    private Graphite getGraphite() {
        return new Graphite(new InetSocketAddress(graphiteHost,
                graphitePort));
    }
}
package app;

import org.springframework.stereotype.Component;

import javax.annotation.PostConstruct;

@Component
public class ProdMetricsConfig extends MetricsConfig {

    private static final String GRAPHITE_PREFIX =
            "collectd/graphite-monitoring-example/production";


    @Override
    protected void configureReporters() {
        configureReporters(GRAPHITE_PREFIX);
    }

    @PostConstruct()
    public void init() {
        configureReporters();
    }
}
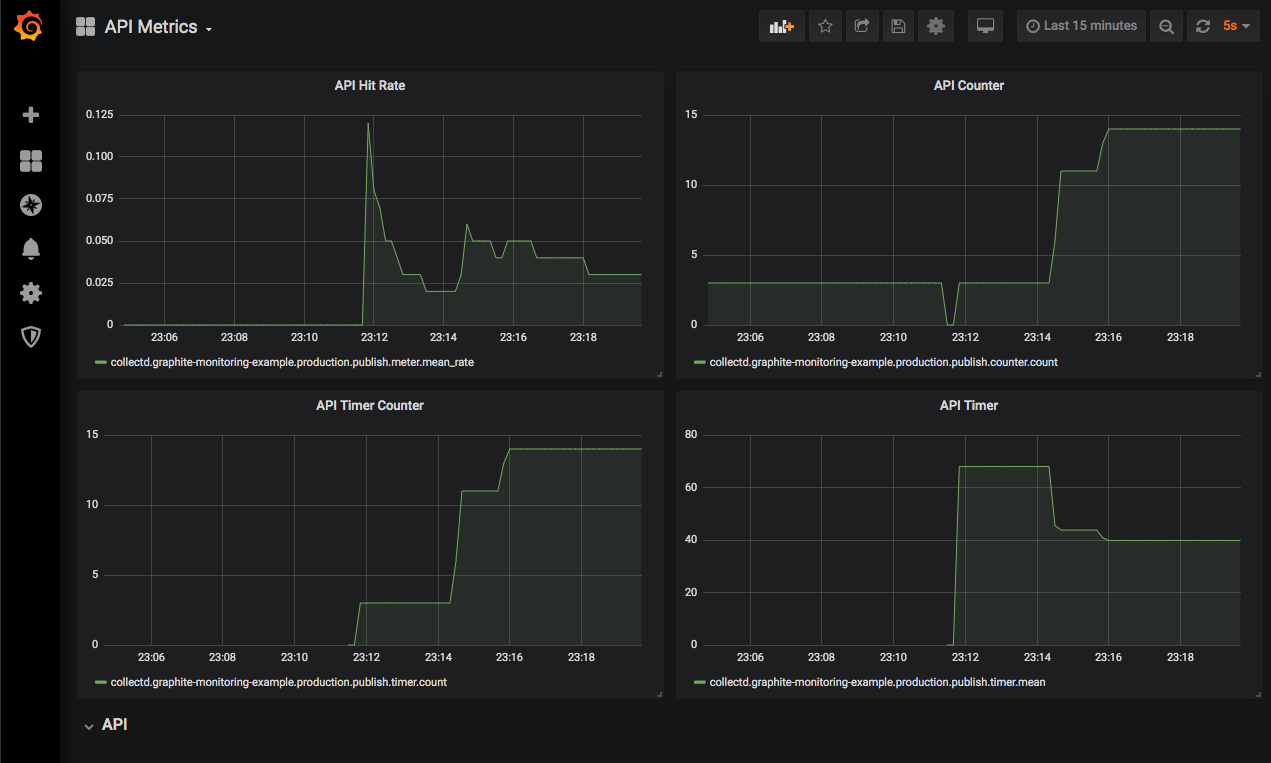
Here is an example of dashboard visualized in Grafana
The above complete project is available on my github repository
The repo contains a dockerized spring boot application, grafana and a graphite instance.
Assuming you have docker installed, just execute below commands to get the project up and running.
./gradlew build
docker build -t metrics-example .
docker-compose up -d
Use http://localhost:3000 to browse the grafana portal and setup your dashboards.
Do let me know if you have any suggestions / feedback