Monitoring Guava Cache Statistics
Guava Cache is one of the most extensive in memory caching library for JVM.
Any high throughput application would not only employ distributed cache such as Redis but also in memory local caching.
The applications I have worked on extensively used Guava Cache to serve thousands of requests per seconds.
One of the problems I have faced in the past is monitoring the performance of the local cache itself. For example, the following metrics are very important to monitor for any cache:
- Hit Rate
- Miss Rate
- No. of entries in the cache
In addition, since Guava is a Loading Cache, it is also very important to monitor The time the cache has spent loading new values
That is when I was looking to solution to these problems, I came across that solution is built itself in Guava Cache through recordstats
As per the documentation of recordstats
Enable the accumulation of CacheStats during the operation of the cache. Without this Cache.stats()will return zero for all statistics. Note that recording stats requires bookkeeping to be performed with each operation, and thus imposes a performance penalty on cache operation.
Since there is a performance overhead of this operation, I recommend that you have a feature flag to enable this functionality and turn it off after collecting the performance statistics for any high throughput application in production.
How to enable record stats?
Simply use the recordStats() function while building the cache
 localCache = CacheBuilder
    .newBuilder()
    .expireAfterWrite(2, TimeUnit.SECONDS)
    .refreshAfterWrite(1,
            TimeUnit.SECONDS)
    .maximumSize(5)
    .recordStats()
    .build(new CacheLoader<>() {
        @Override
        public MatchListDO load(Integer key) {

        }

        @Override
        public ListenableFuture<Integer> reload(Integer key, MatchListDO oldValue) {

        }
    });
How do I visualize the data?
The best way to visualize the Guava cache statistics is through Spring boot Actuator -> Prometheus -> Grafana
First ensure that Spring boot actuator is enabled for your project. It can be done by adding the dependency
<dependency>
	<groupId>org.springframework.boot</groupId>
	<artifactId>spring-boot-starter-actuator</artifactId>
</dependency>
And adding the relevant properties in the configuration
management:
  metrics:
    export:
      prometheus:
        enabled: true
    enable.jvm: true

    distribution:
      percentiles-histogram:
        http:
          server:
            requests: true

  endpoints:
    web:
      exposure:
        include: health, prometheus, loggers, metrics, scheduledtasks, threaddump, info
Then, we enable prometheus monitoring in our application, by adding the micrometer dependency
<dependency>
	<groupId>io.micrometer</groupId>
	<artifactId>micrometer-registry-prometheus</artifactId>
</dependency>
Finally we hookup our cache with micrometer using the GuavaCacheMetrics
GuavaCacheMetrics.monitor(meterRegistry, localCache, "localCache");
I created a Guava cache monitoring dashboard in Grafana:
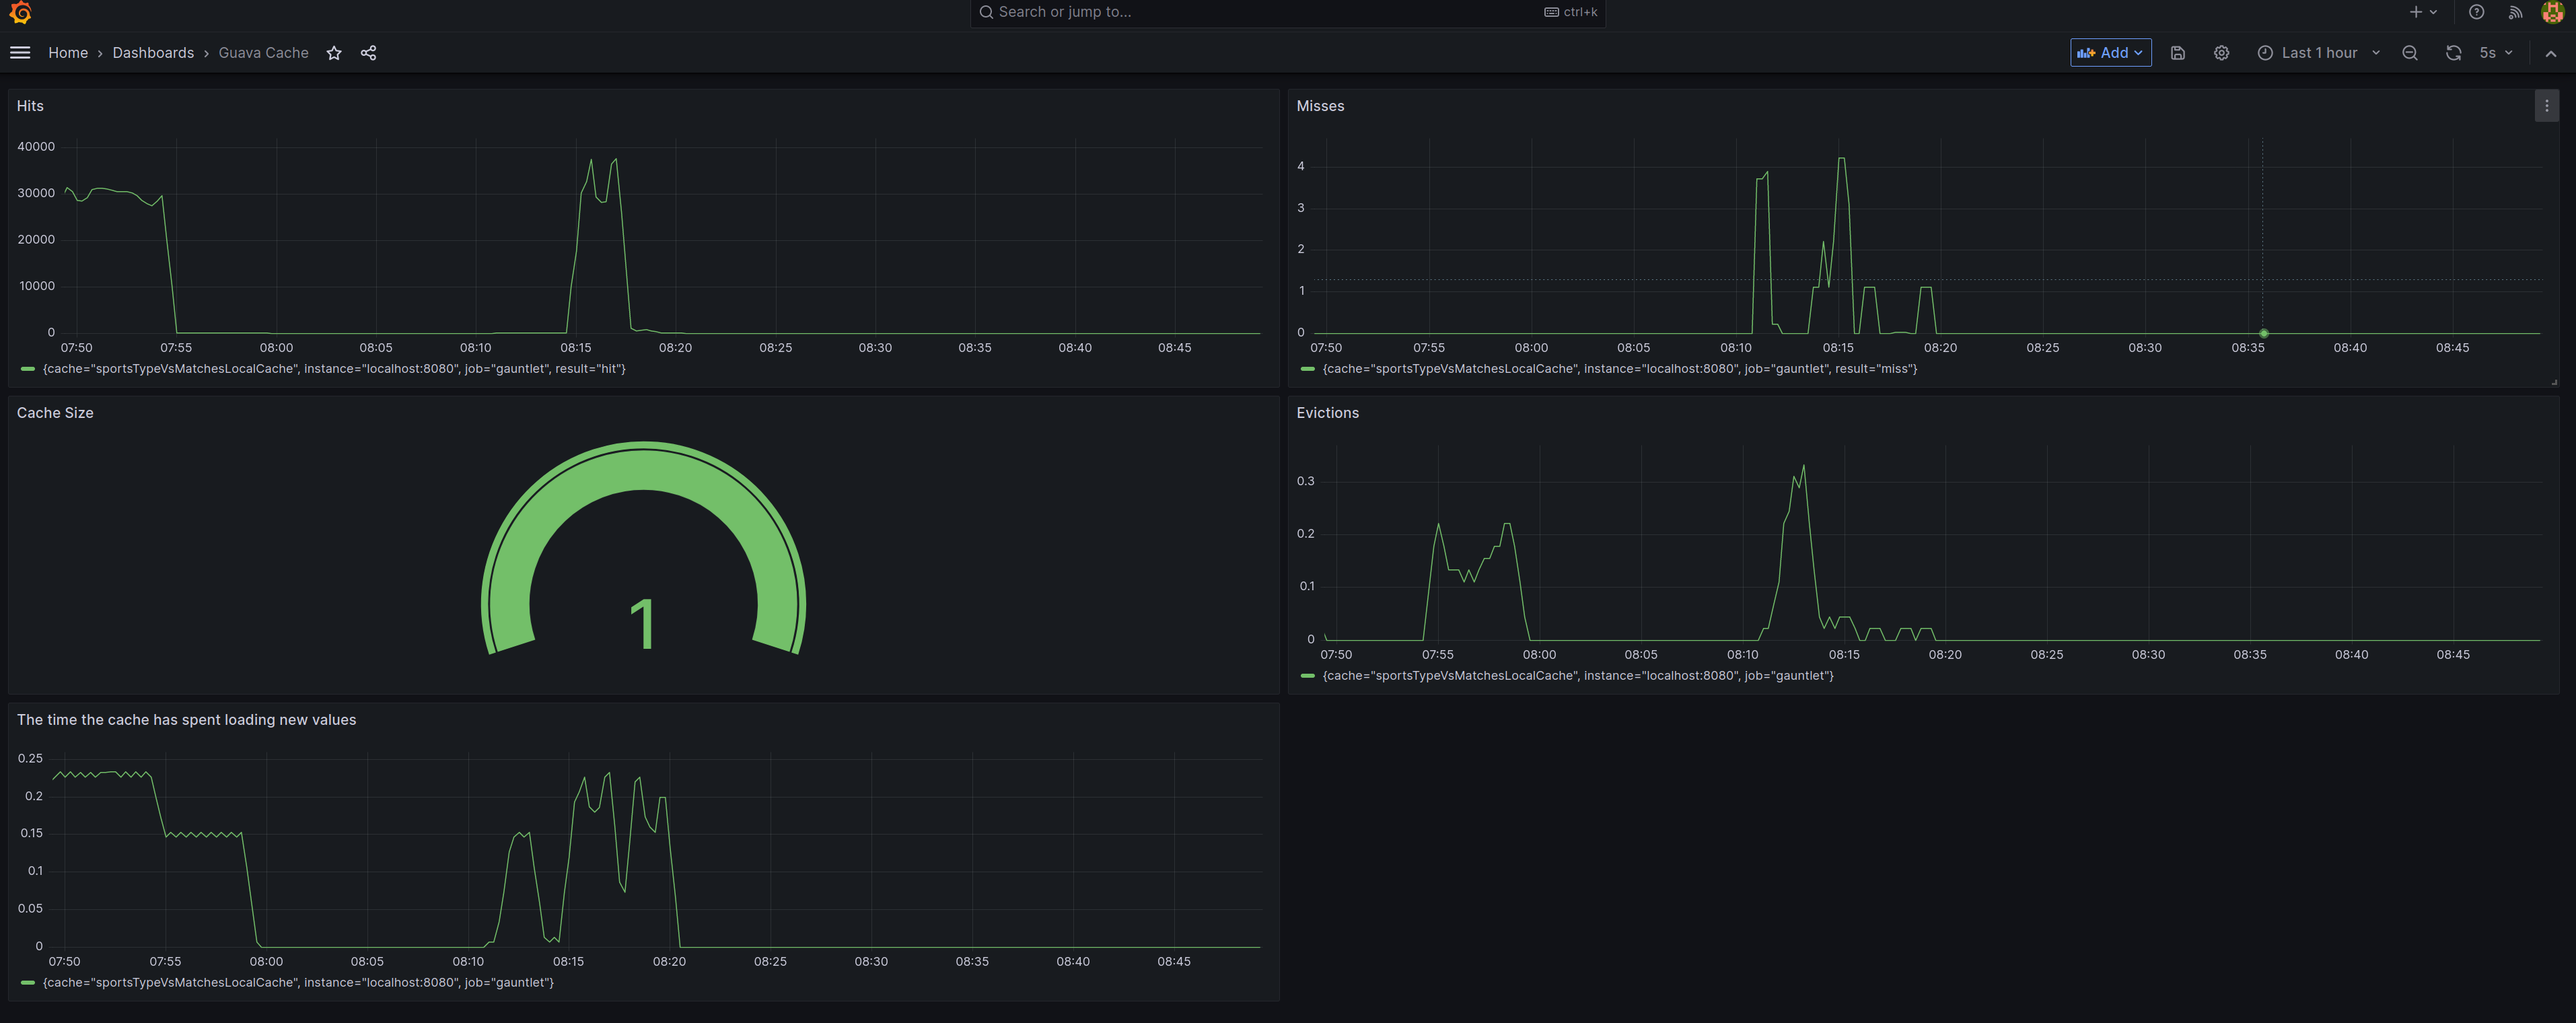
I have uploaded this sample application on github along with the Grafana dashboard